Console.trace() - Javascript Debugging Tips
Please share this post if you enjoy it!
Little Known But Powerful Tool – console.trace()
A while ago I released a post and a video about using console.table as part of your javascript debugging arsenal. I got a great reception from it and many people said they where shocked it wasn’t more well known. So now I shall continue that with console.trace.
A few weeks ago, an article popped up on Medium that took a run through more of the console API – one of which was console.trace. It has gained a lot of traction and many people are talking about it. This has lead me into creating my own series going over some more of the powerful tools at your disposal – much like I did with console.table
The First Of Many
This post will be the start of a mini series that will be focusing on different tools that JavaScript developers can use to speed up their debugging workflow.
I wanted to start with console.trace because it is such a powerful tool that has a huge range of useful applications and I know it has certainly saved me a ton of time over my career.
Starting off, I just created a simple HTML structure that will allow us to call a javascript file. This isn’t interesting, but I’ll show you the code anyway.
1
2
3
4
5
6
7
8
9
10
11
<html lang="en">
<head>
  <meta charset="UTF-8"/>
	<title>Console.Trace</title>
</head>
<body>
  <h1>Experimenting With console.trace()</h1>

  <script src="script.js"></script>
</body>
</html>
Now for the interesting part…
The Javascript Code
This is the javascript I am starting with.
1
2
3
4
5
6
7
8
9
10
11
12
13
function app(){
	function doSomething(){
	  var a = 1;
		var b = 2;
		alert( sumFunction(a, b) );
	}
	function sumFunction(a, b){
		return a + b;
	}

  doSomething();
}
app();
Of course this code is a bit contrived and not very useful in the real world, but it will serve our purpose just fine. The important part is that there are many functions that call other functions. This will create something that is called the call stack – a list of all the functions that have been called, in the order they were called.
This code is pretty basic. We have an app function that is called at the bottom of the file. The app function contains two other functions – doSomething and sumFunction.
The doSomething function is called at the bottom of the app function. doSomething then declares two variables and passes them into the sumFunction as arguments.
sumFunction just adds the two numbers together and returns the result, which is then alerted out.
What Exactly Does Console.trace do?
In simple terms, console.trace will log to the console the call stack that exists at the point console.trace was called.
Why is this useful?
Well, let’s assume the javascript I have shown you above is a small part of a huge codebase. There are many files and many different functions.
We have established that the code has a bug in it somewhere, but we aren’t sure exactly where it is. We have narrowed it down to being somewhere just before the sumFunction is called.
Unfortunately, the sumFunction is called in many different places in many different files. It’s impossible to know straight away which call to the function is creating the bug.
How Would Some Developers Attack This Problem?
I have seem many developers who do not know of console.trace tackle this sort of dilemma by throwing in lots of console.logs with different messages all over the code. The code then runs and whichever was the last logged message in the console when the bug occurs is the likely culprit.
Of course, there is nothing wrong with this method – it works. But it does mean a lot of redundant typing and copying and pasting to get all the console.logs into the code and then again to remove them all when we are done. Not to mention if you forget one in the code you may end up with logged messages in production code – VERY MESSY!
In steps console.trace
Instead, we can place a call to console.trace in the code at the point we want to trace back from. So in the javascript above we want to trace back from the sumFunction so we place the console.trace in there like this:
1
2
3
4
5
function sumFunction(a, b){
  console.trace("Our First Trace");

  return a + b;
}
Notice we can pass it in an argument which will simply be the name of that particular stack trace. This allows us to have multiple different instances of console.trace and we can differentiate between them as they will all have unique names.
Before we run this code, let’s take a look at the code again – this time with the call to console.trace – and think about what the stack trace should look like.
1
2
3
4
5
6
7
8
9
10
11
12
13
14
15
16
17
function app(){
  function doSomething(){
    var a = 1;
		var b = 2;

		alert( sumFunction(a, b) );
	}

	function sumFunction(a, b){
    console.trace("Our First Trace");
		return a + b;
	}

	doSomething();
}

app();
For starters, the last function that was called before the console.trace was triggered was the sumFunction. So that will be the top of the call stack.
Where was the sumFunction called? That was inside the doSomething function, so that will be the next call below the sumFunction on the call stack (remember a stack starts at the bottom and any new things are placed on top. So the newest item is on the top and the oldest on the bottom).
What called the doSomething function? That would have been the app function. So that is next down the stack.
Finally, what called the app function? Well that was called out in the open space of our javascript file – which is the global namespace. So it was the global namespace that called the app function.
So the call stack should look like this: sumFunction, doSomething, app, global namespace.
What Does console.trace Output?
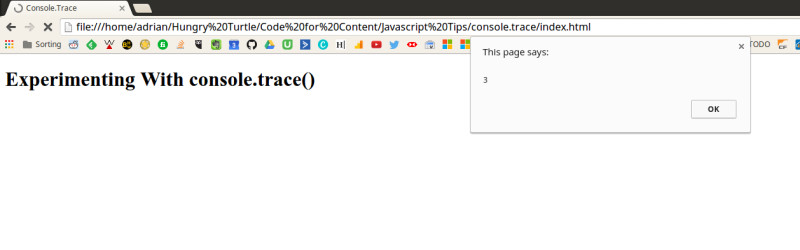
We still get the alert box showing in the window, just like we did before, but the interesting stuff is happening in the console.
This is the output into the console when we run the code.
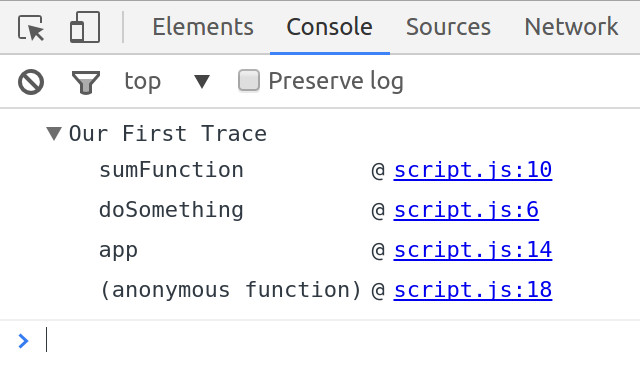
Exactly what we expected except the bottom of the stack is (anonymous function) instead of global namespace. But the global namespace is just an unnamed function in javascript, so that is why it tells us it’s an anonymous function. But we know that it is just the global namespace.
We are also shown what file each call was made from and what line in that file it was made from.
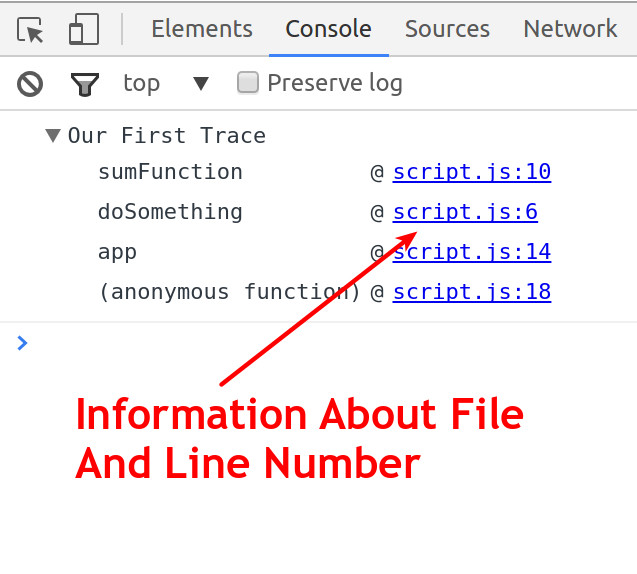
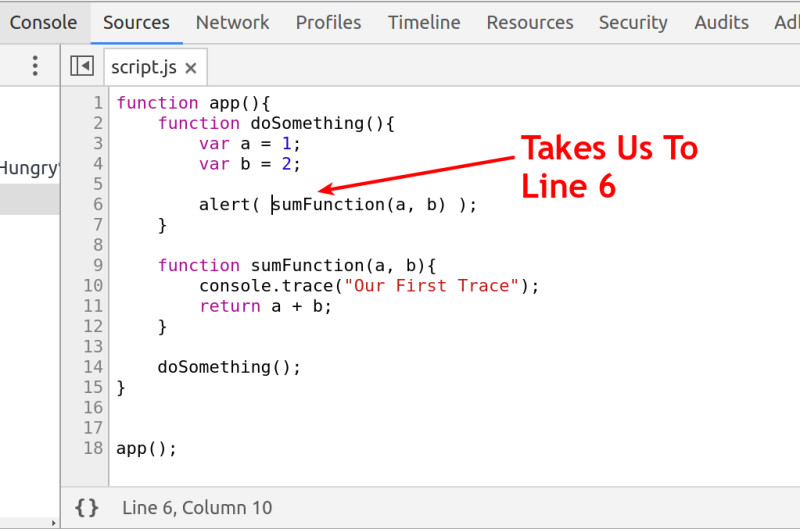
These are interactive links too. We can click on the file name and line number next to the call from the doSomething function and it will take us to the sources tab in Chrome Dev Tools and straight to that line inside the doSomething function that calls the next function on the stack. In our case it will take us to line 6, where the sumFunction is called.
Ultimately, that is all you need to know to use console.trace in your debugging workflow. It is instantly easier to clean up, as you have replaced many calls to console.log all over your javascript files with a single call to console.trace. Remove that one line and your code is back to being clean code ready for deployment.
An Added Bonus – Best Practice
As an added bonus I will show you a nice ninja way of using console.trace with Chrome Dev Tools in your local development environment that will allow you to never have a console.trace call inside your code and keep your codebase clean the whole time.
Let’s assume we don’t have that console.trace call in the code anymore – the javascript is exactly as it was in the first snippet above.
Now we run that in the browser. Open up Chrome Dev Tools and navigate to the sources tab.
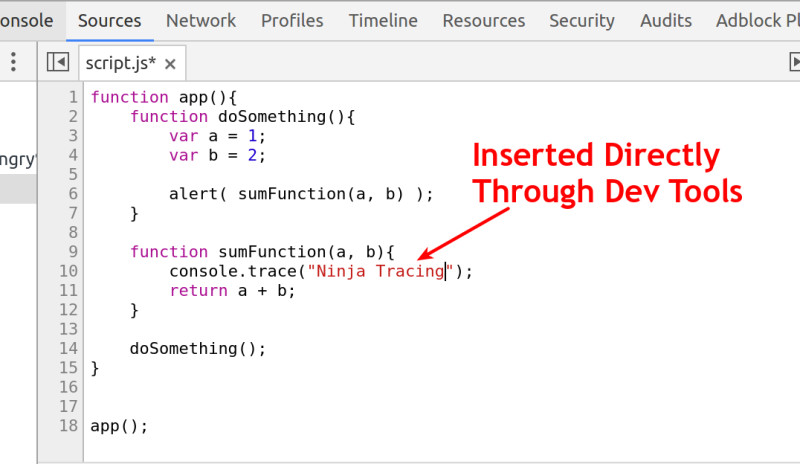
Inside the sources tab you can type code in, just like you can in your editor. Here is where you type the console.trace call. Like this:
Breakpoint Or Call The Function Manually
Unfortunately, the code we are interested in has already run when we refreshed the browser. You could avoid this by setting a breakpoint above the console.trace then refresh again, or you can manually trigger the app function via the console.
For the sake of showing you, I will trigger the app function again in the console. This will again cause the console.trace to log out the call stack.
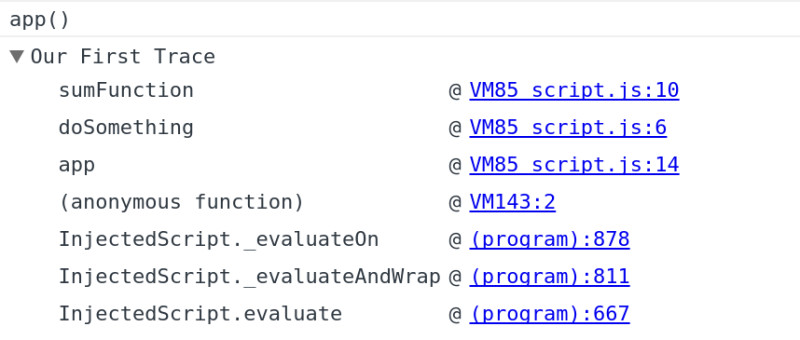
Notice here that the call stack is slightly different. This is because we called the app function from the console so the call stack has to track back further to get to the first call as the console adds some magic in the background. But the top of the stack is still identical as it was before.
We can now click on the links and navigate through the areas of the code involved in the call stack, just like we could before.
The benefit this time is that the console.trace was never actually in the javascript file, it was only in the code inside dev tools. So we don’t have to worry about removing it from the code when we deploy. It is just one less thing to worry about, which is always a good thing right?
That’s all I have this time.
I look forward to seeing you for the next part of this Javascript debugging tips series.
But until then,
Stay hungry and keep coding,
Adrian
Please tell your friends about this if you found it useful…