Debug() – Javascript Debugging Tips
Please share this post if you enjoy it!
Debug() – The Death Of Ctrl+f
If you are anything like me, you have wasted countless hours of your life using ctrl+f to find functions inside your code. If you only have one file, ctrl+f is still going to be your best bet. But as soon as you start dealing with many files, the debug() method becomes a life saver!
This post will be continuing with my Javascript debugging series. If this is the first one you are seeing, you may be interested in some of the others as well.
This isn’t going to be a long one today. The debug method is a pretty simple one to get your head around.
The HTML we are starting with is slightly different this time.
1
2
3
4
5
6
7
8
9
10
11
12
13
14
15
16
17
<!DOCTYPE html>
<html lang="en">
<head>
	<meta charset="UTF-8">
	<title>Debug Method</title>
</head>
<body>
  <h1>Experimenting With debug()</h1>

  <script src="script.js"></script>
  <script src="script2.js"></script>
  <script src="script3.js"></script>
  <script src="script4.js"></script>
  <script src="script5.js"></script>

</body>
</html>
We are starting with 5 different script files to illustrate the power of the debug method. Inside each of these files we have 10 functions. Each of which just output their number as an alert. Like this:
1
2
3
4
5
6
7
8
9
10
11
12
13
14
15
16
17
18
19
20
21
22
23
24
25
26
27
function function1(){
  alert("1");
}
function function2(){
  alert("2");
}
function function3(){
  alert("3");
}
function function4(){
  alert("4");
}
function function5(){
  alert("5");
}
function function6(){
  alert("6");
}
function function7(){
  alert("7");
}
function function8(){
  alert("8");
}
function function9(){
  alert("9");
}
I Want To Find function23
Let’s assume that we don’t know what file function23 is in, but we want to find it. We are inside the browser and open up the sources tab. We could open up all the script files and start with the trusty ctrl+f in all the files looking for function23.
Or, we could use the debug method. All we need to do is pass the name of the function that we want to find into the debug method. In our case debug(function23). Run it in the console.
Nothing happened!
What is happening now, is the code is being monitored. Any time the function23 is called the code execution will stop and you will be jumped straight to the sources tab and taking into the code for function23. Pretty cool! Let’s try it by invoking function23 manually in the console.
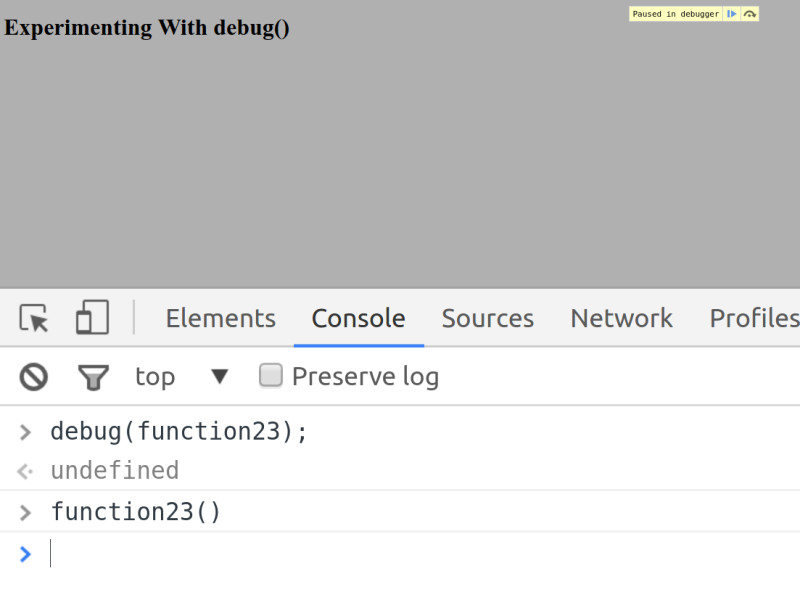
Straight away you can see that the execution of the code has been paused as soon as we called function23 manually from the console. Below you can also see where the code jumped to. Yep, function23 is highlighted, inside script3.js. No need to have to use ctrl+f to find that little rascal again!
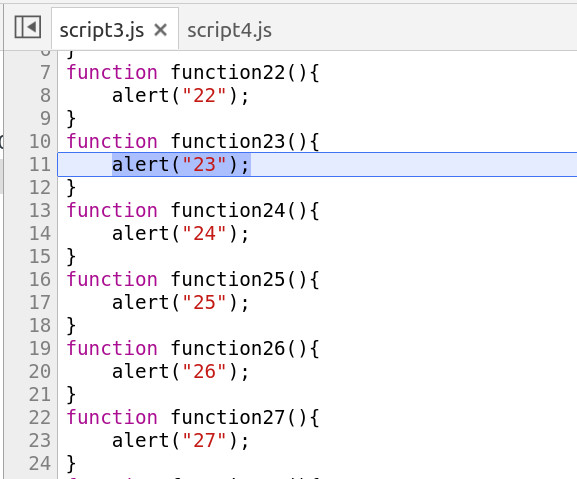
Code Paused Before The Function Runs
A pretty awesome part about this is that the code execution pauses before the code inside the function runs. This means that if you in your local environment you can now add code into that function directly from the sources tab and then execute it without ever having to tamper with the actual file.
This can then tie in with other tips I have written about, like console.trace.
Maybe we know that a bug occurs somewhere in the callstack leading up to function23 but we don’t know the exact call stack as the application is dynamic. We can use debug on function23 and then use the application until the bug occurs, which will lead to a pause at function23.
Now we can insert a console.trace onto the first line of the function then resume execution. This console.trace will give us the exact call stack that lead up to the function23 call in this use case.
Can you see how using all these tips and ideas together can really speed things up? That means more time to do the actual coding!
Until next time,
Stay hungry and keep coding,
Adrian